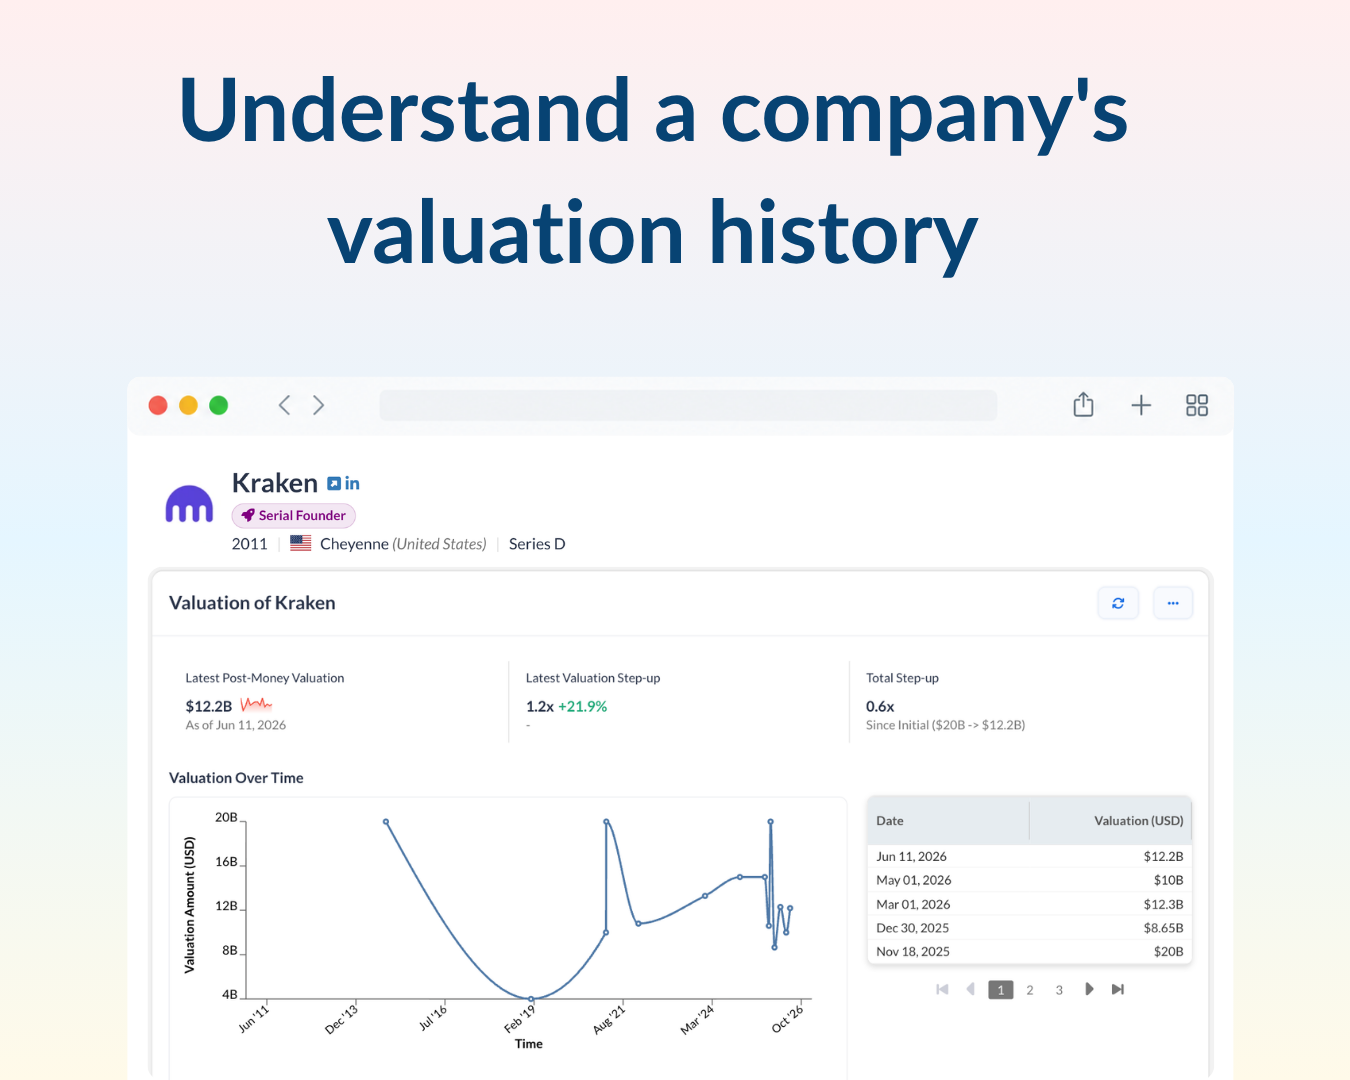
See where a company stands today – Start with the latest post-money valuation. Then see how much it has stepped up in the latest event and since the first one. For example, see Perplexity’s valuation, which climbed from $150M in 2023 to $22.6B in 2026.
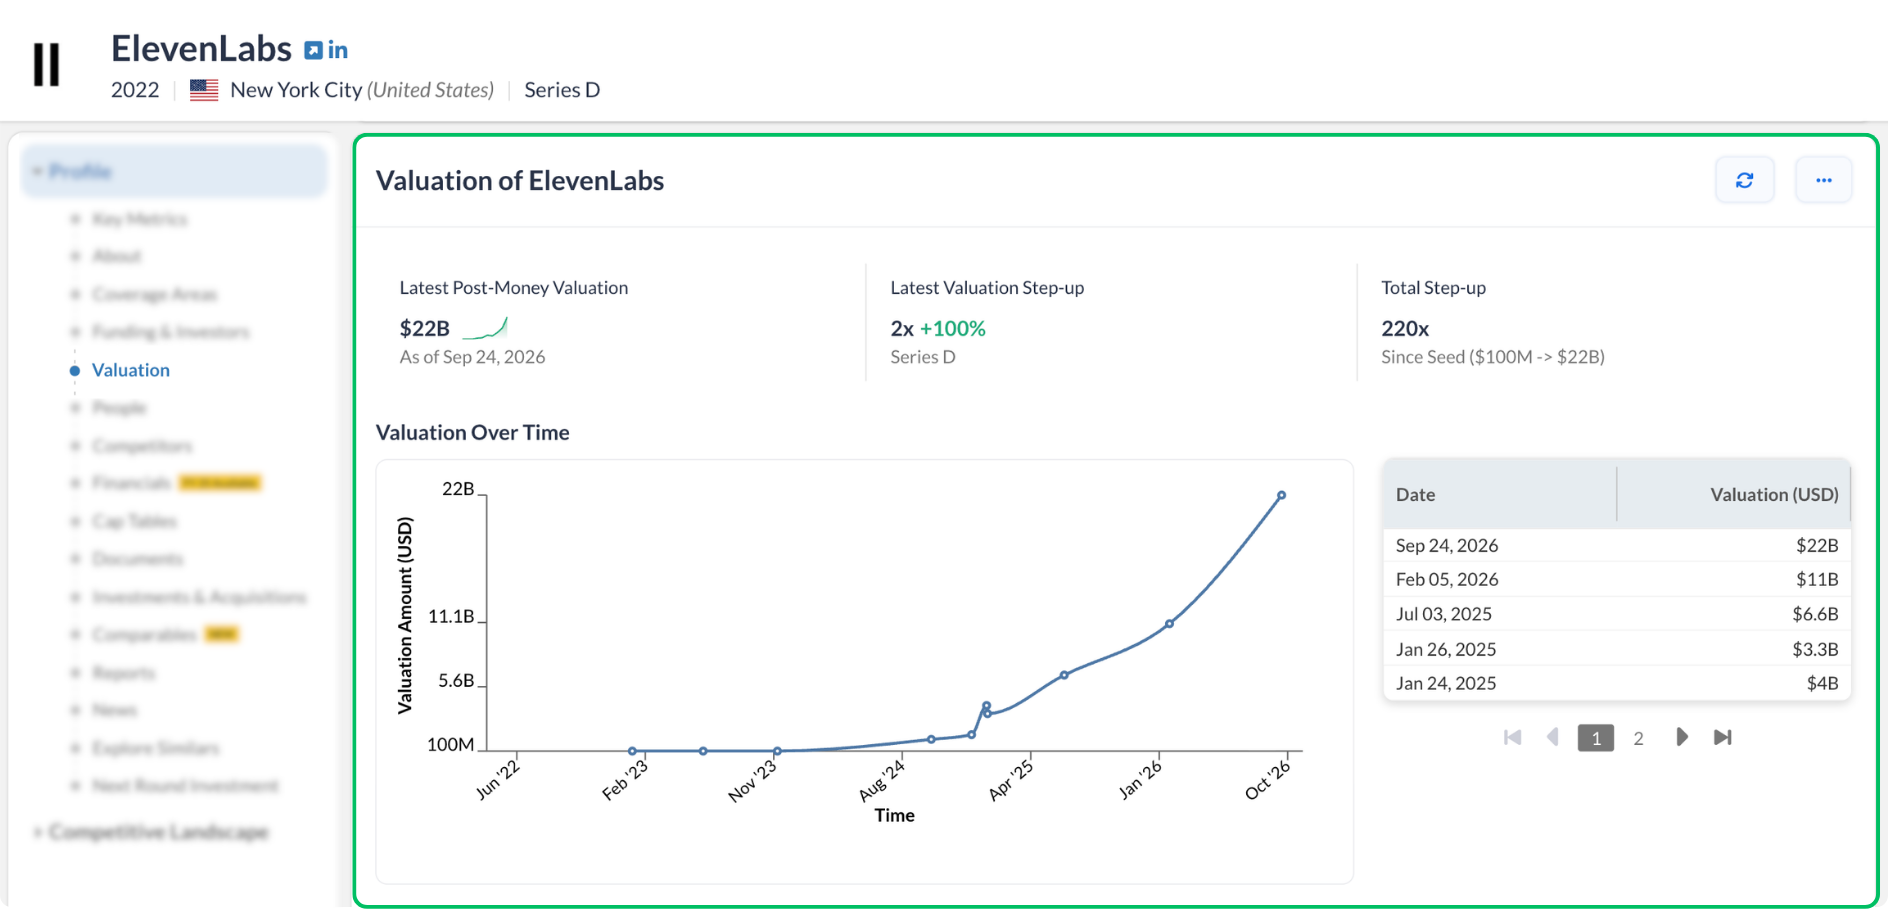
Spot the pattern – The valuation chart shows whether a company grew steadily, jumped sharply, or stayed flat. Hover over any point to see the round, date, valuation, and more. For example, see Company ElevenLab’s valuation trend.
Know where each number comes from – The history table lists every valuation with its step-up, type, and more - plus the event and source behind it, where available.