Access comprehensive sector profiles to understand industry landscapes, discover niche business models through structured taxonomy, track funding, acquisition, and IPO trends, and leverage key benchmarks to make informed investment decisions.
Track the Business Models Powering Future Growth in Your Sector
Get a clear view of your sector’s structure, key players, and the business models driving growth to make confident, data-backed decisions.
Analyze Sector Taxonomies
Our proprietary taxonomy maps niche business models within each sector, helping you explore the full landscape and identify opportunities that align with your strategic goals
Map the Competitive Landscape
Visualize the competitive landscape instantly with interactive market maps that highlight leading companies, emerging players, and key segments across the sector ecosystem.
Track Capital Flows by Category
Discover high-growth opportunities by exploring the most funded business models, including total funding raised and notable companies operating within them.
Discover what's possible with Tracxn
Gain a complete view of funding, acquisitions, and IPO activity across your chosen sector, along with benchmarking insights to identify trends, evaluate opportunities, and make informed investment decisions.
What is the YoY capital allocation trend across different funding round stages within the cybersecurity sector?
How are Online Travel companies distributed globally by country?
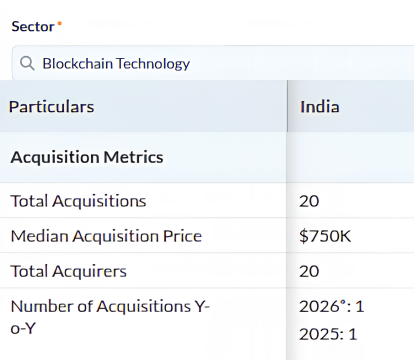
What is the YoY acquisition volume and median deal price in the consumer sector?
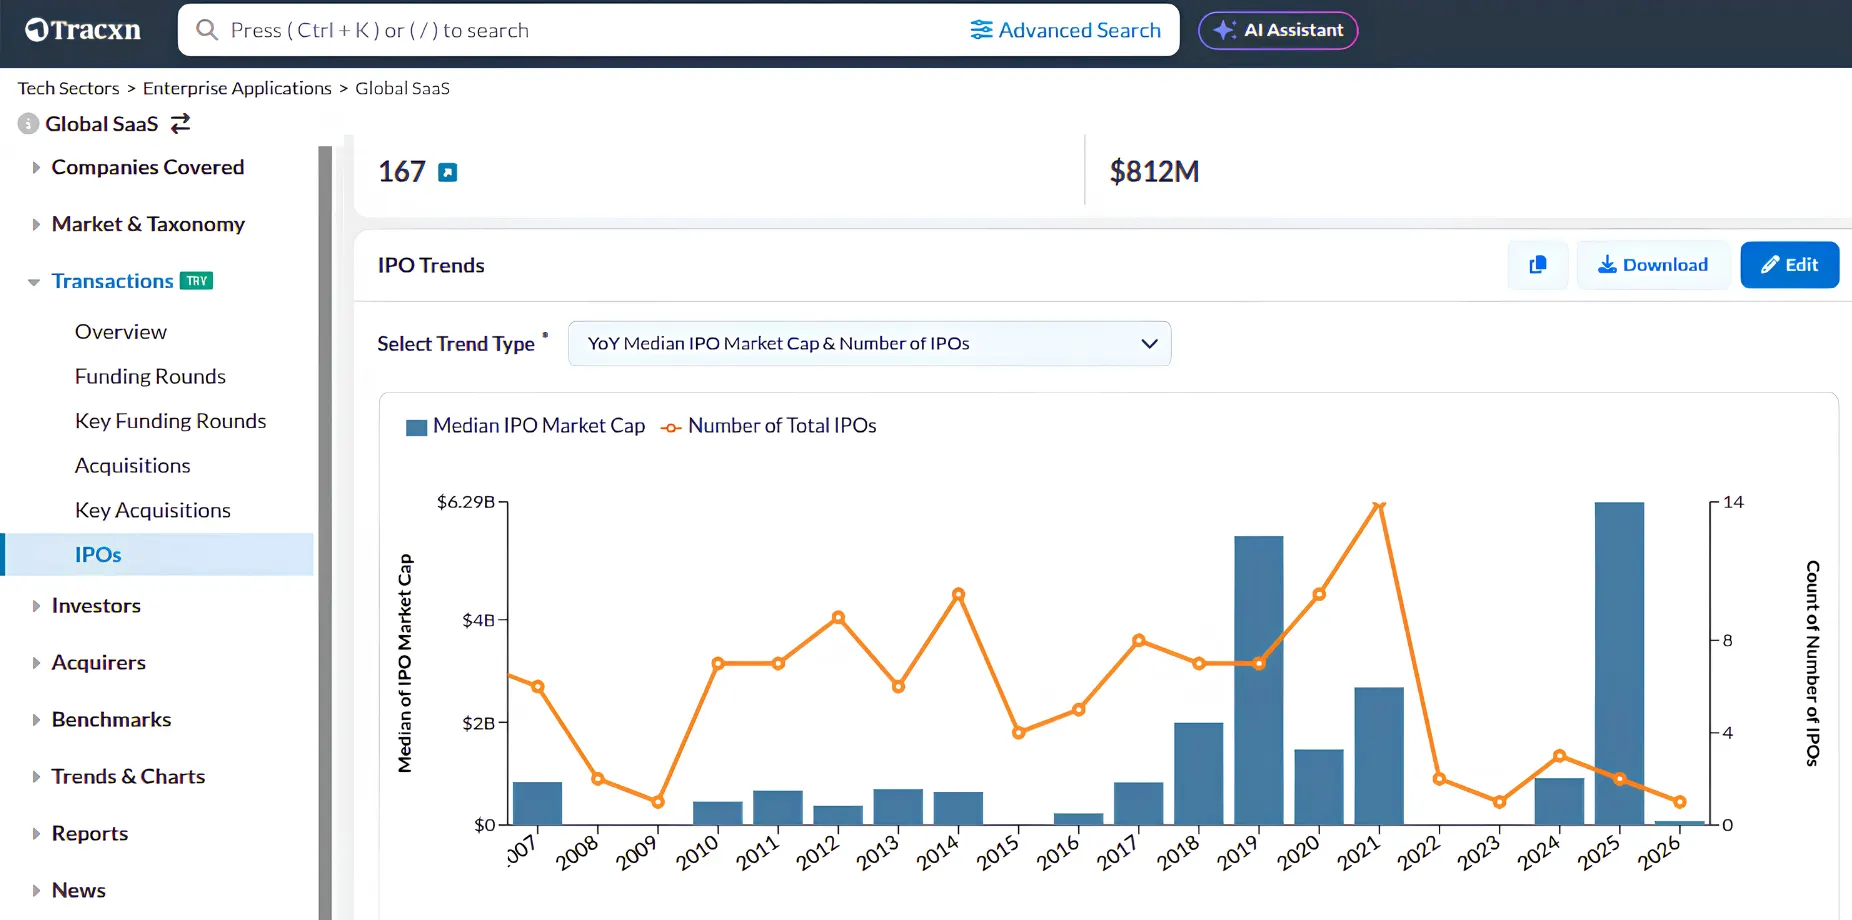
What are the peak years for YoY median market cap and total listing counts in the Global SaaS sector?
Access Ready-to-Use Sector Fact Sheets and Market Intelligence
Download structured sector reports and monitor real-time market developments with insights designed to support faster research, benchmarking, and strategic analysis.
Track top sectors & their funding activity
Visualize acquisitions by geography
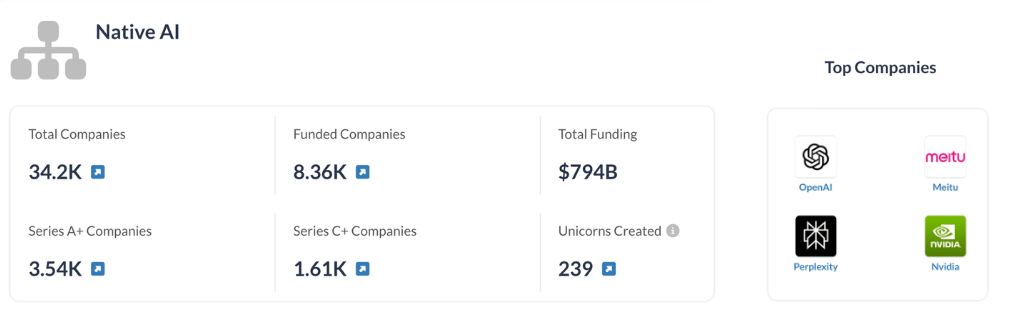
Analyse industry-specific metrics and evaluate category leaders simultaneously
Join thousands of teams using Tracxn to track global funding activity

%20(1).webp)
%20(1).webp)
.webp)

%20(1).webp)
.webp)
.webp)
.png)