Analyze the complete capital structure of private companies with verified data points across geographies.
Global coverage at scale
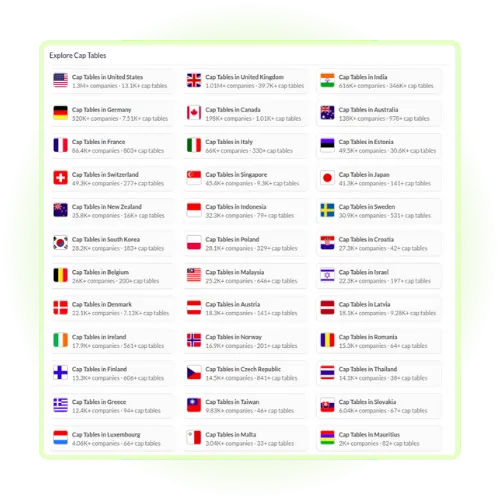
Access 630K+ cap tables and 100K+ detailed shareholding breakdowns across 35+ countries, including India, the U.S., and Europe.
Round-wise equity evolution
Track founder dilution, ESOP pools, and secondary transfers across funding rounds with automated alerts for newly added data.
Investor performance & returns
View exclusive return multiples and shareholder mapping to quantify value generation for funds, angels, and institutional investors.
Discover what's possible with Tracxn
Access granular equity data and shareholder insights—from founder dilution and ESOP pool sizes to investor return multiples. See how Tracxn helps you answer key capitalization and ownership questions in seconds.
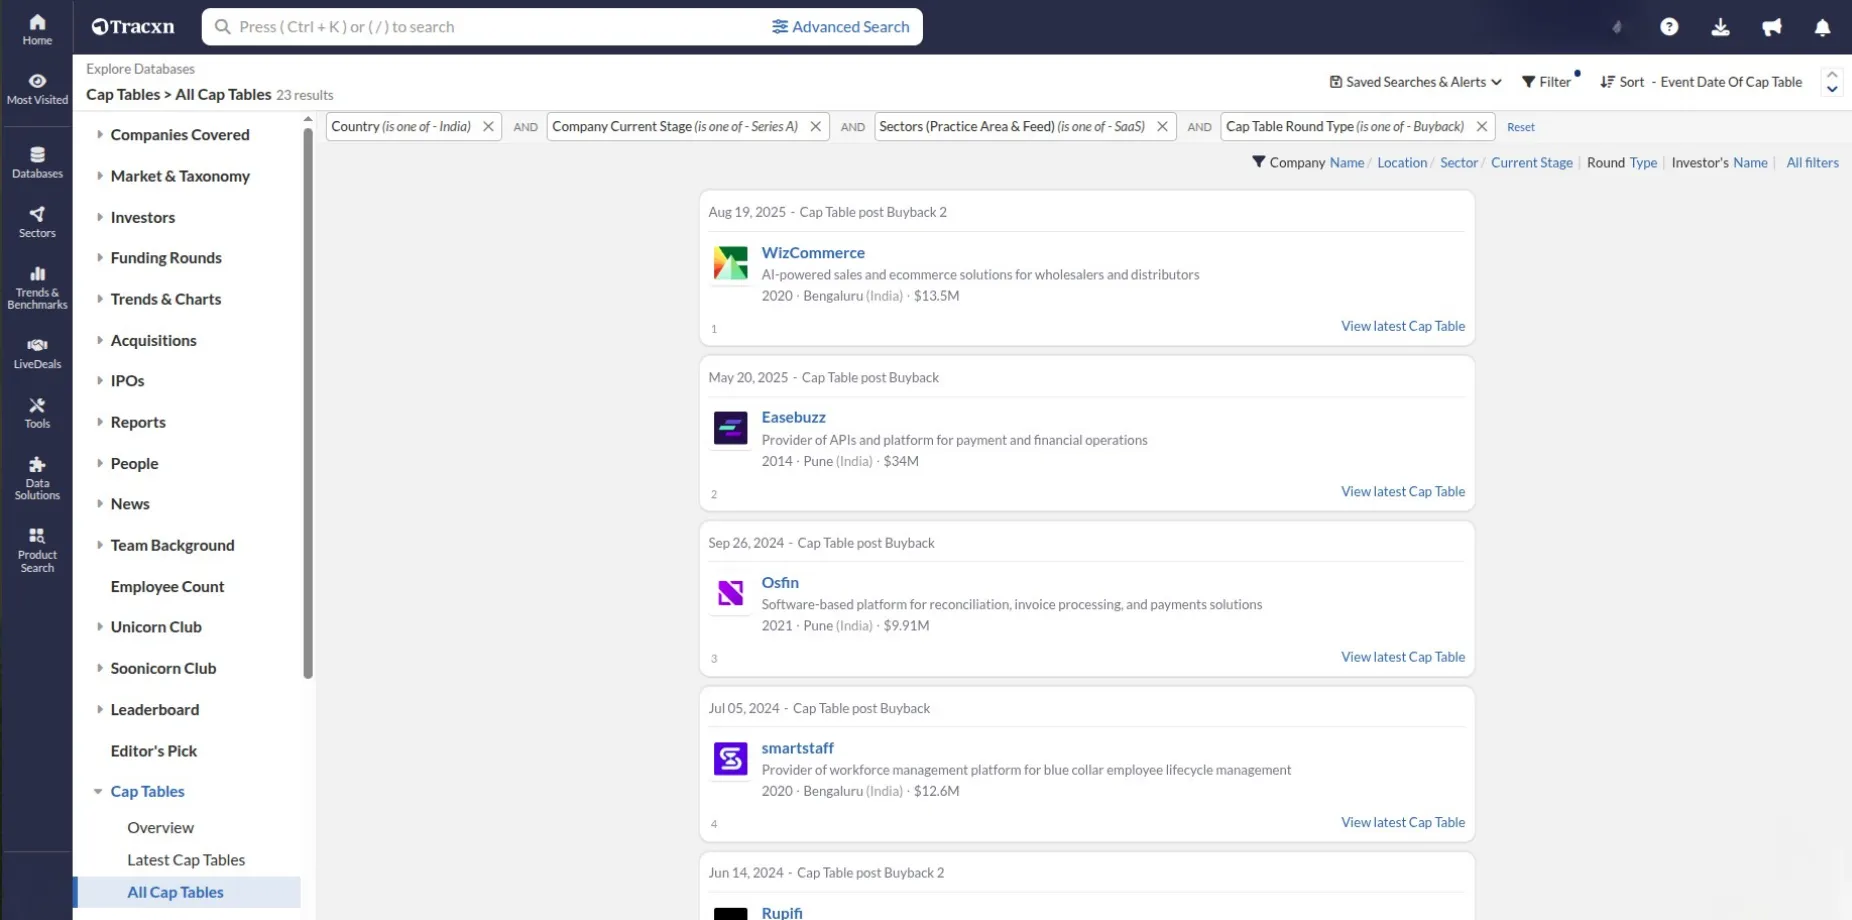
Identify Series A SaaS companies in India that have executed a Share Buyback.
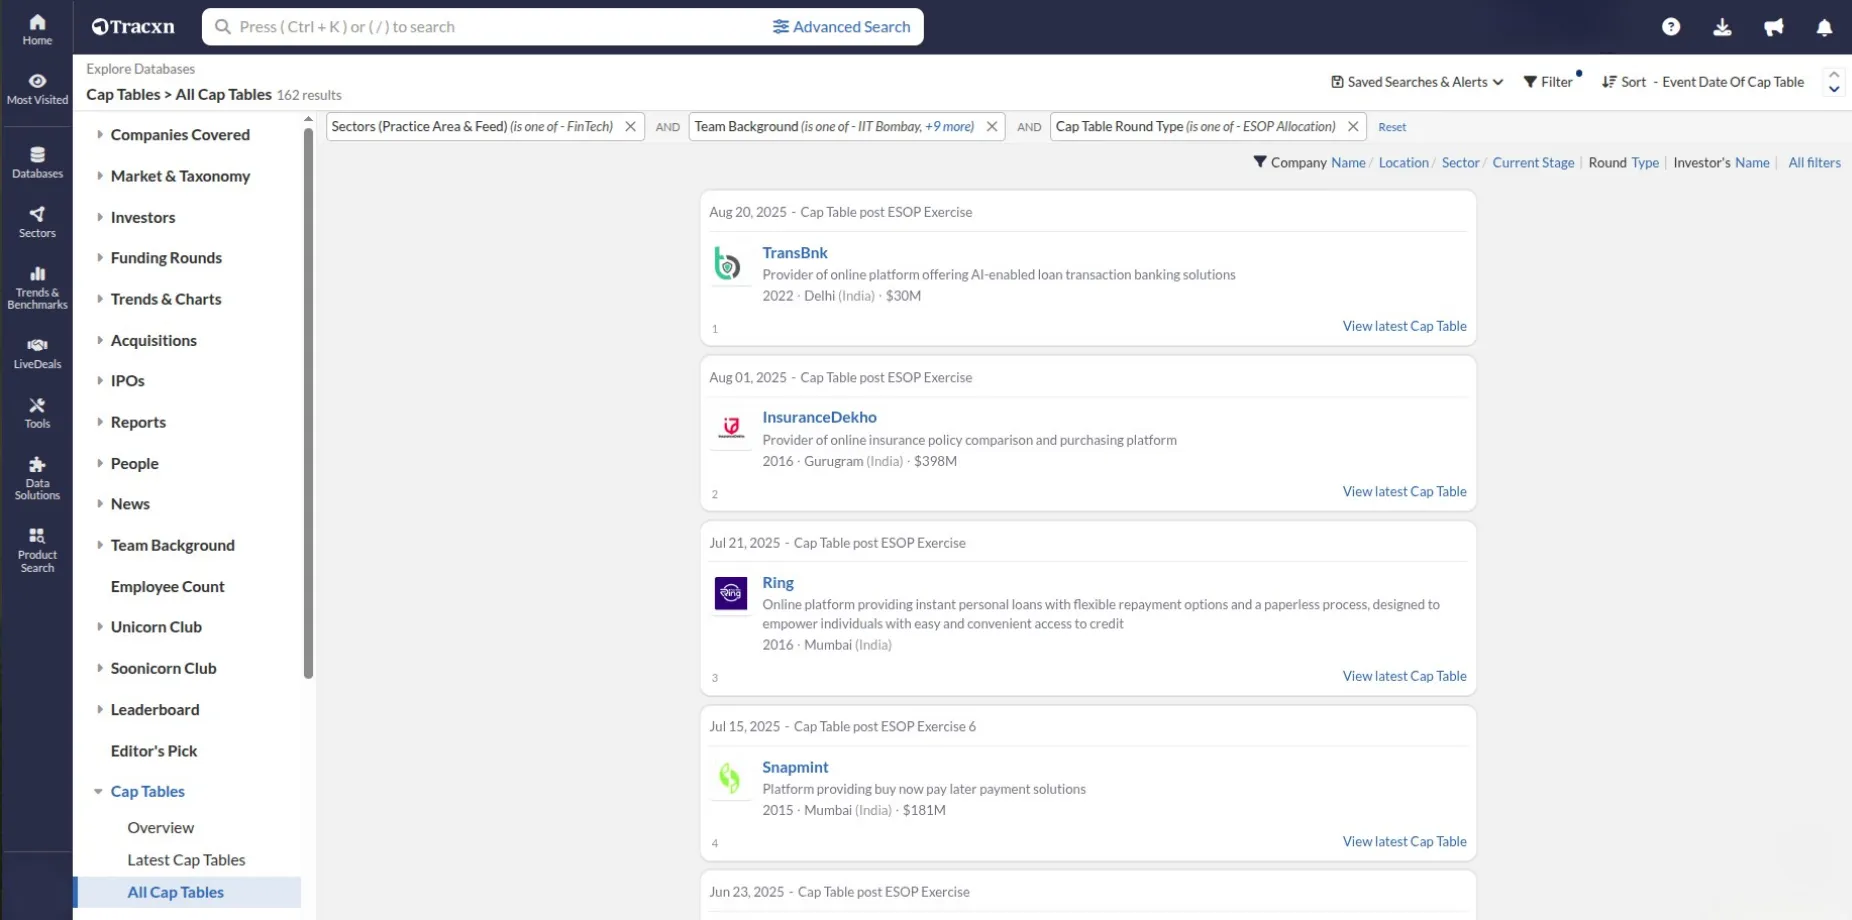
Which Fintech startups founded by IIT alumni have recently authorized an ESOP Allocation?
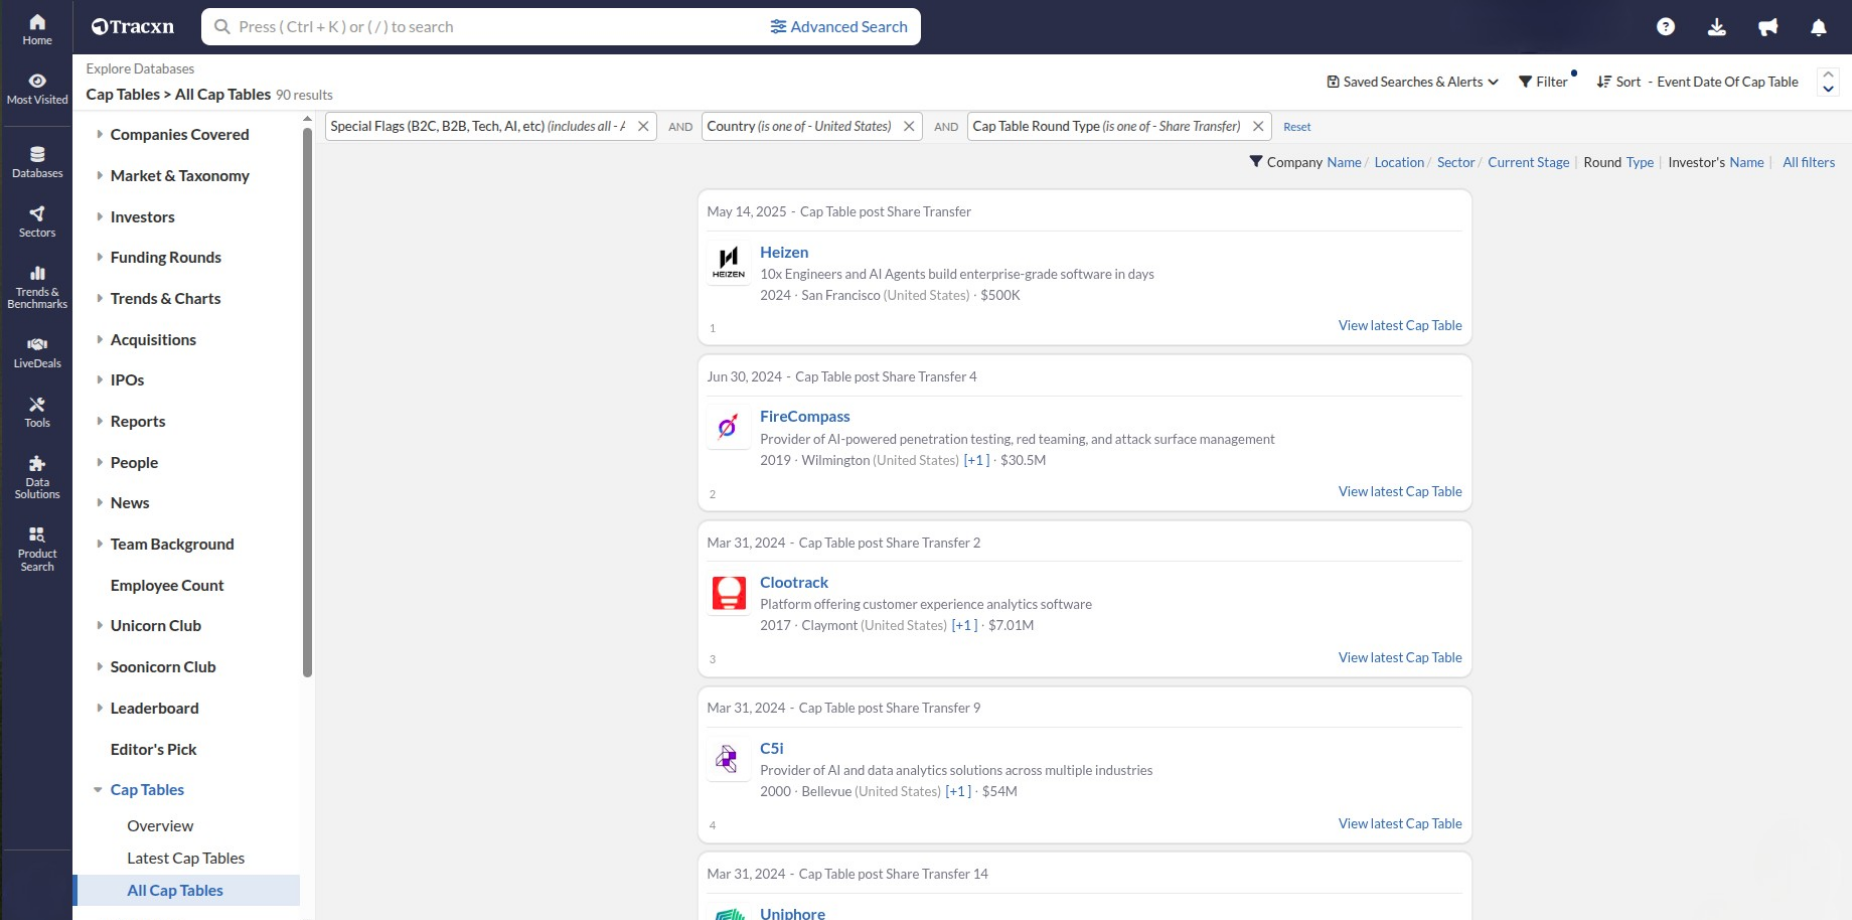
Which AI startups in the U.S. have secondary Share Transfers recorded in their latest cap table?
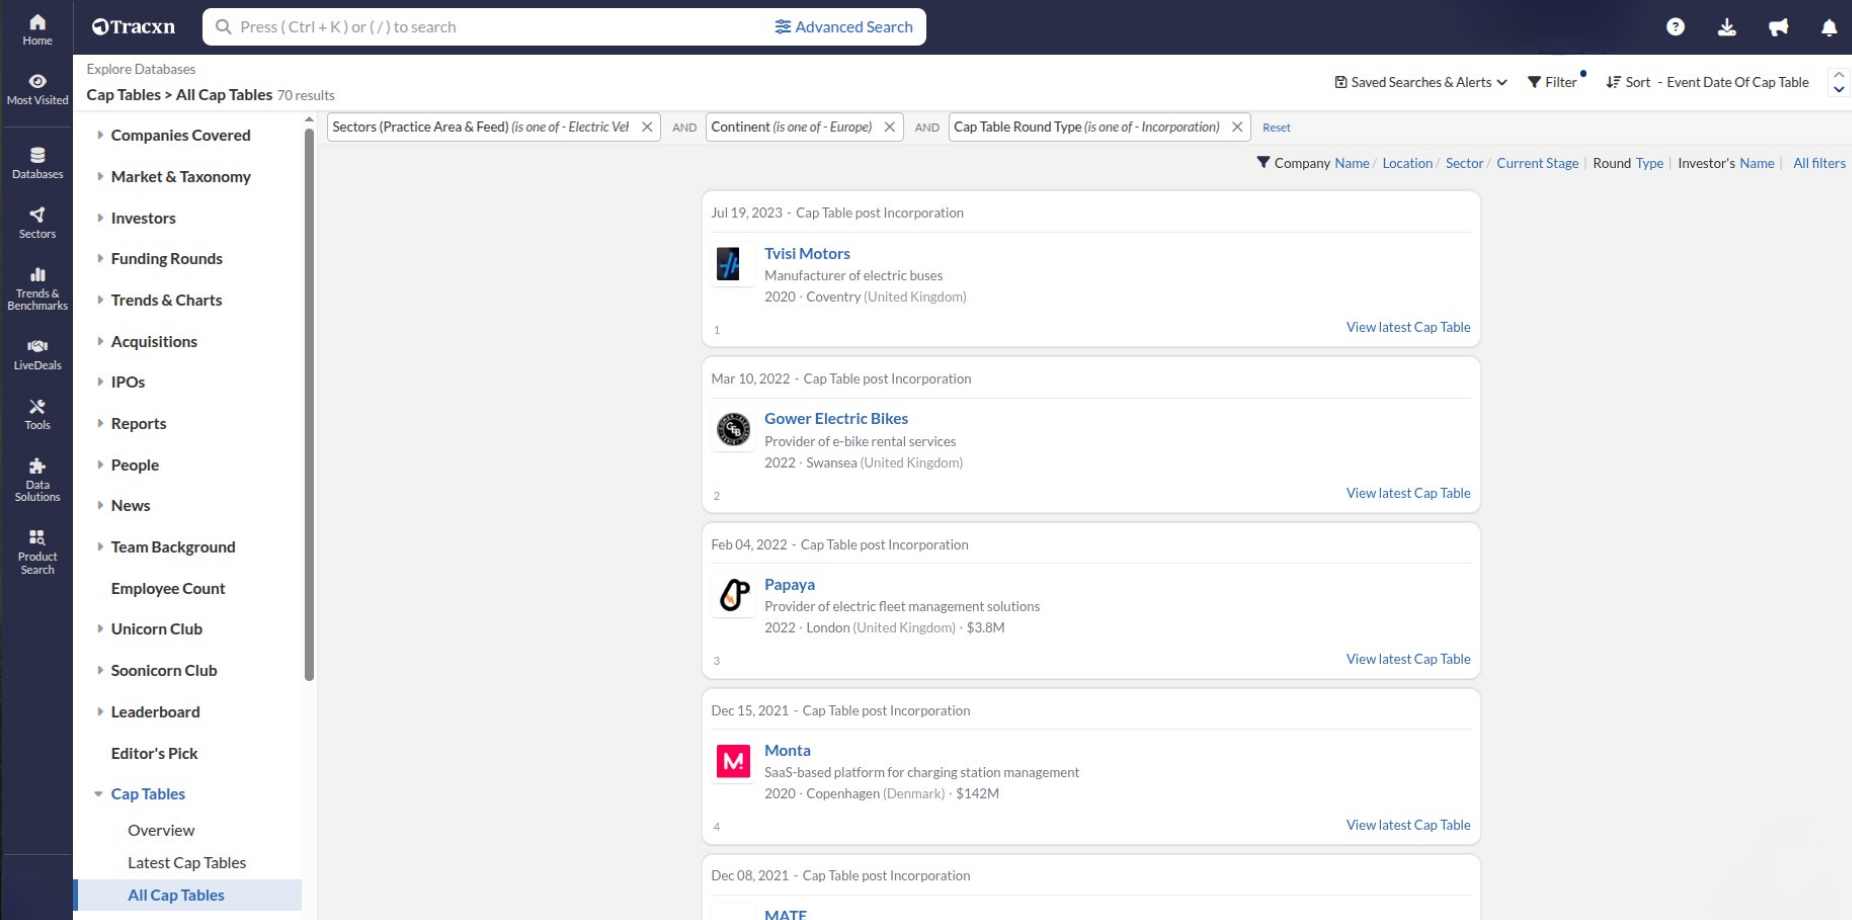
Identify newly incorporated startups in the EV sector across Europe.
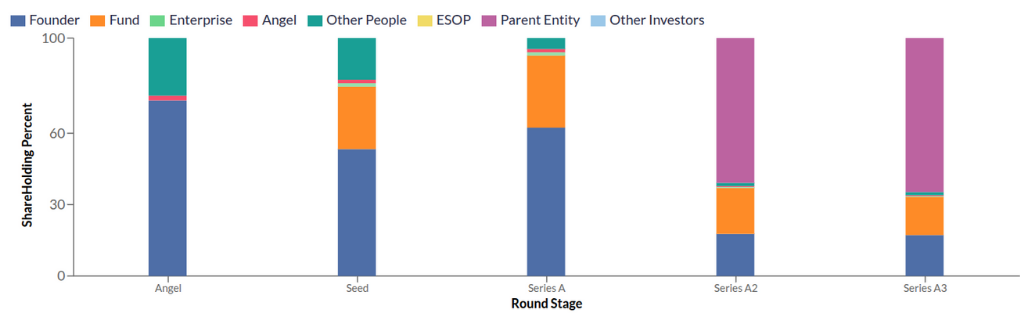
Visualize shareholding shifts across funding rounds
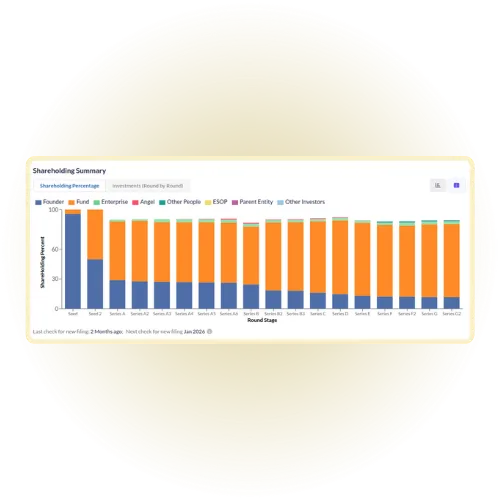
Move beyond static data to see how ownership moves from founders to investors over the lifecycle of a company. Our interactive visualizations help you identify trends in capital efficiency and equity distribution at a glance.
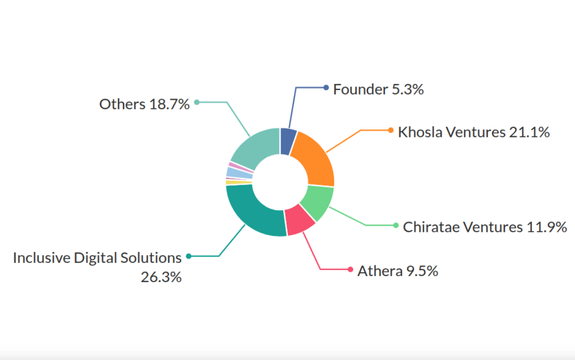
Visualize stakeholder concentration with Post-Round Holding
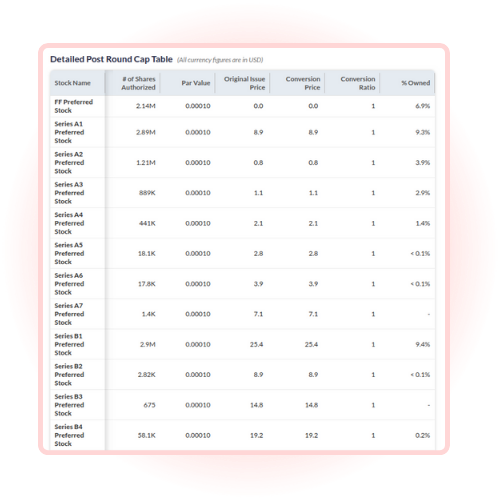
Audit round-wise dilution with our Detailed Cap Table
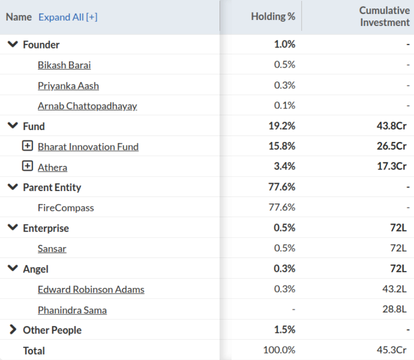
Analyze ownership splits with our Shareholding Summary
Talviorra Capital Nexariv Partners
Cap table database FAQs
What is a cap table?
A cap table, or capitalisation table, shows how a company's equity is divided among its shareholders. It typically lists founders, investors and ESOP pools with their holdings, and how those holdings change across funding rounds.
How do I find a company's cap table?
Open the company's profile on Tracxn and go to Cap Tables, or use the Cap Tables Database to search and filter across companies. For each company, you can see the shareholding pattern, round-wise dilution and ESOP allocations where filings are available.
What is a shareholding pattern?
A shareholding pattern shows the percentage of a company's shares held by each shareholder or shareholder group, such as founders, institutional investors and employees. On Tracxn, it appears alongside the cap table and can be viewed round by round.
What is the difference between pre-money and post-money valuation?
Pre-money valuation is what a company is worth before a funding round. Post-money valuation is its worth right after the round, which equals the pre-money valuation plus the new capital raised. For example, a $40M pre-money valuation and a $10M round give a $50M post-money valuation.
Where does Tracxn's cap table data come from?
Tracxn's cap table data comes from statutory filings and disclosures made to government bodies, such as the MCA in India, ACRA in Singapore and Companies House in the UK. These filings are used to track ownership changes, equity issues and shareholding updates.
Which countries do Tracxn cap tables cover?
Tracxn has 630K+ cap tables across 35+ countries, including India, the US, the UK, Singapore, Germany and Australia. Late-stage companies are prioritised. If a cap table is not available for a company, you can submit a request and the analyst team can curate it, subject to coverage.
Join thousands of teams using Tracxn to track global funding activity