
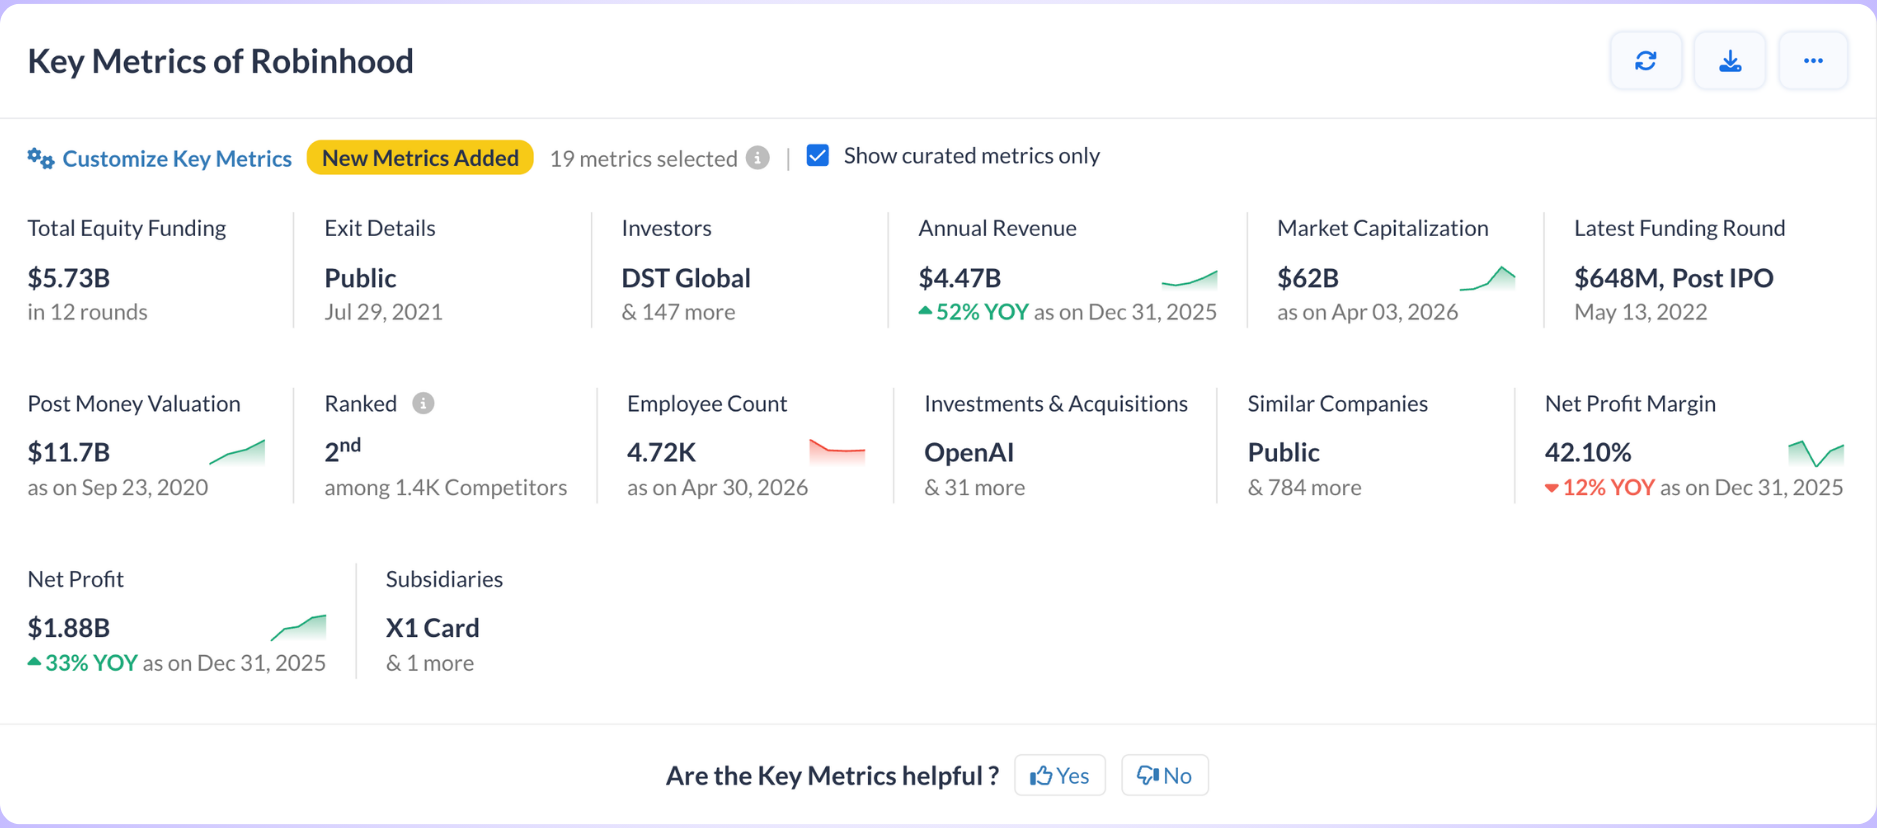
Every Key Metric now displays a trend chart next to its value, plotting how the figure has changed across recent years. Trend charts cover:
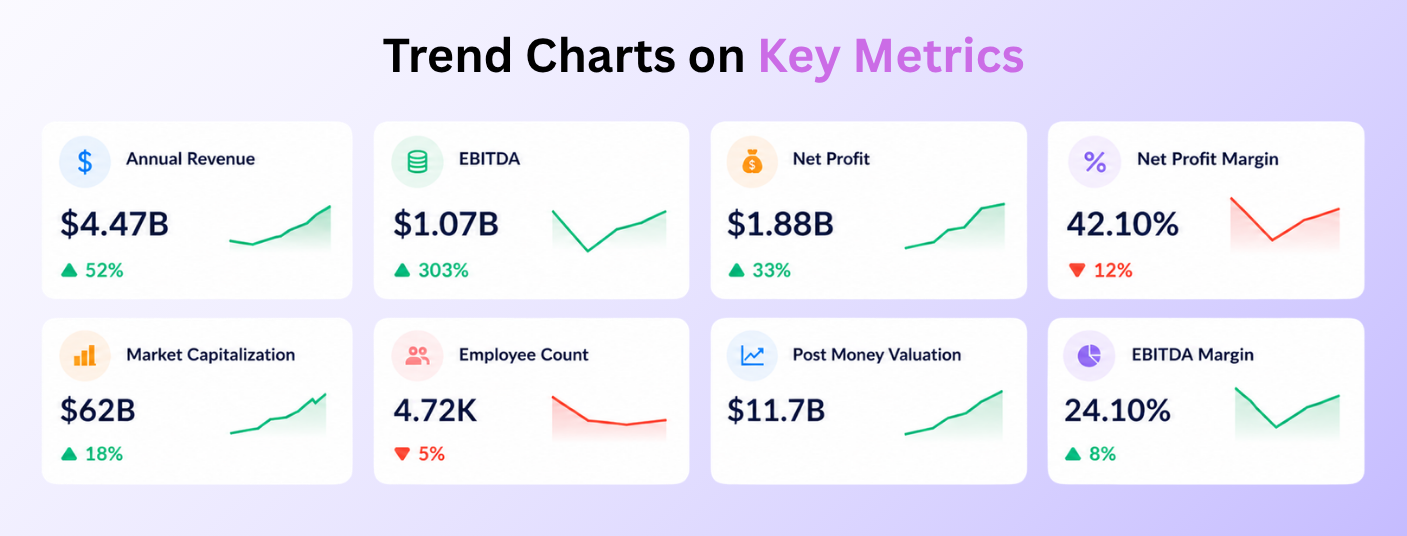
Use this when sizing up a company before an investment decision or competitive review. If revenue is growing but margins are shrinking, you can spot that divergence in seconds - without pulling separate reports.
Charts display up to 5 consecutive years of data. For financial metrics, a chart appears once consecutive annual data is available for the latest 3 financial years.
Note: You can find this on the company profile page, and the same Key Metrics charts are available on the Legal Entity Detail Page as well.
We’ve got you covered 24/7.
Reach out via live chat, email at support, or WhatsApp—we’re always here to help.
Premium features, no strings attached. See what the full platform can do for your research.