Access complete Workforce Trends across Global Companies
Monitor hiring velocity and organisational scaling for over 250K+ entities. Identify high-growth startups, validate business stability, and benchmark team expansion across sectors and geographies.
Get a clear view of headcount data to understand company health and find breakout signals before the rest of the market.
Track Growth Velocity
Analyse year-on-year headcount changes to identify companies in hyper-growth phases. Use historical trends to distinguish sustainable scaling from temporary hiring spikes.
Save Custom Views for Tracking
Filter companies by region, sector, or funding stage.Then, sort your results by revenue, or Tracxn Score to see how hiring correlates with key milestones. Finally, save your custom views for easy benchmarking & long-term monitoring
Data-Driven Due Diligence
Layer headcount trends with funding and revenue data using intuitive charts. Visualize trends for any company to assess operational scale & organisational maturity during due diligence.
Discover what's possible with Tracxn
See how Tracxn's employee count data helps you benchmark peers, track hiring trends, analyze workforce growth, and make confident talent acquisition decisions.
How does Company X's headcount compare to its top 5 competitors in SaaS?
Which AI startups in the US have shown the most growth in the past 12 months ?
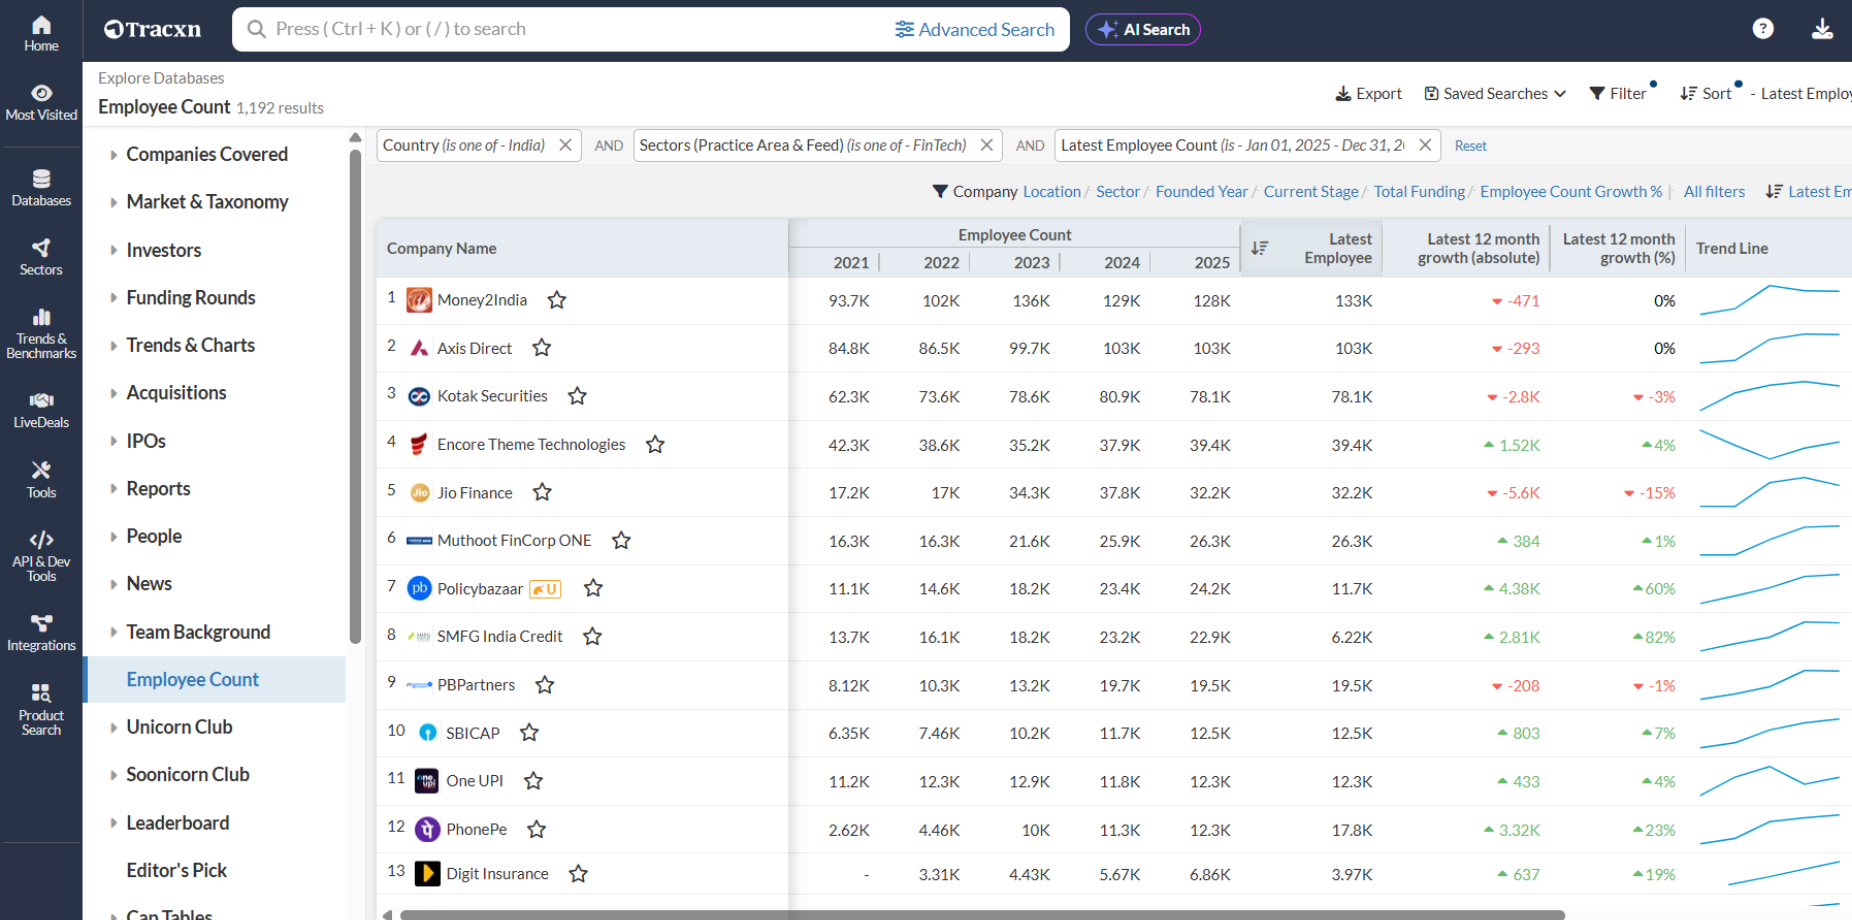
Which Fintech company in India has grown its workforce fastest over the last calender year?
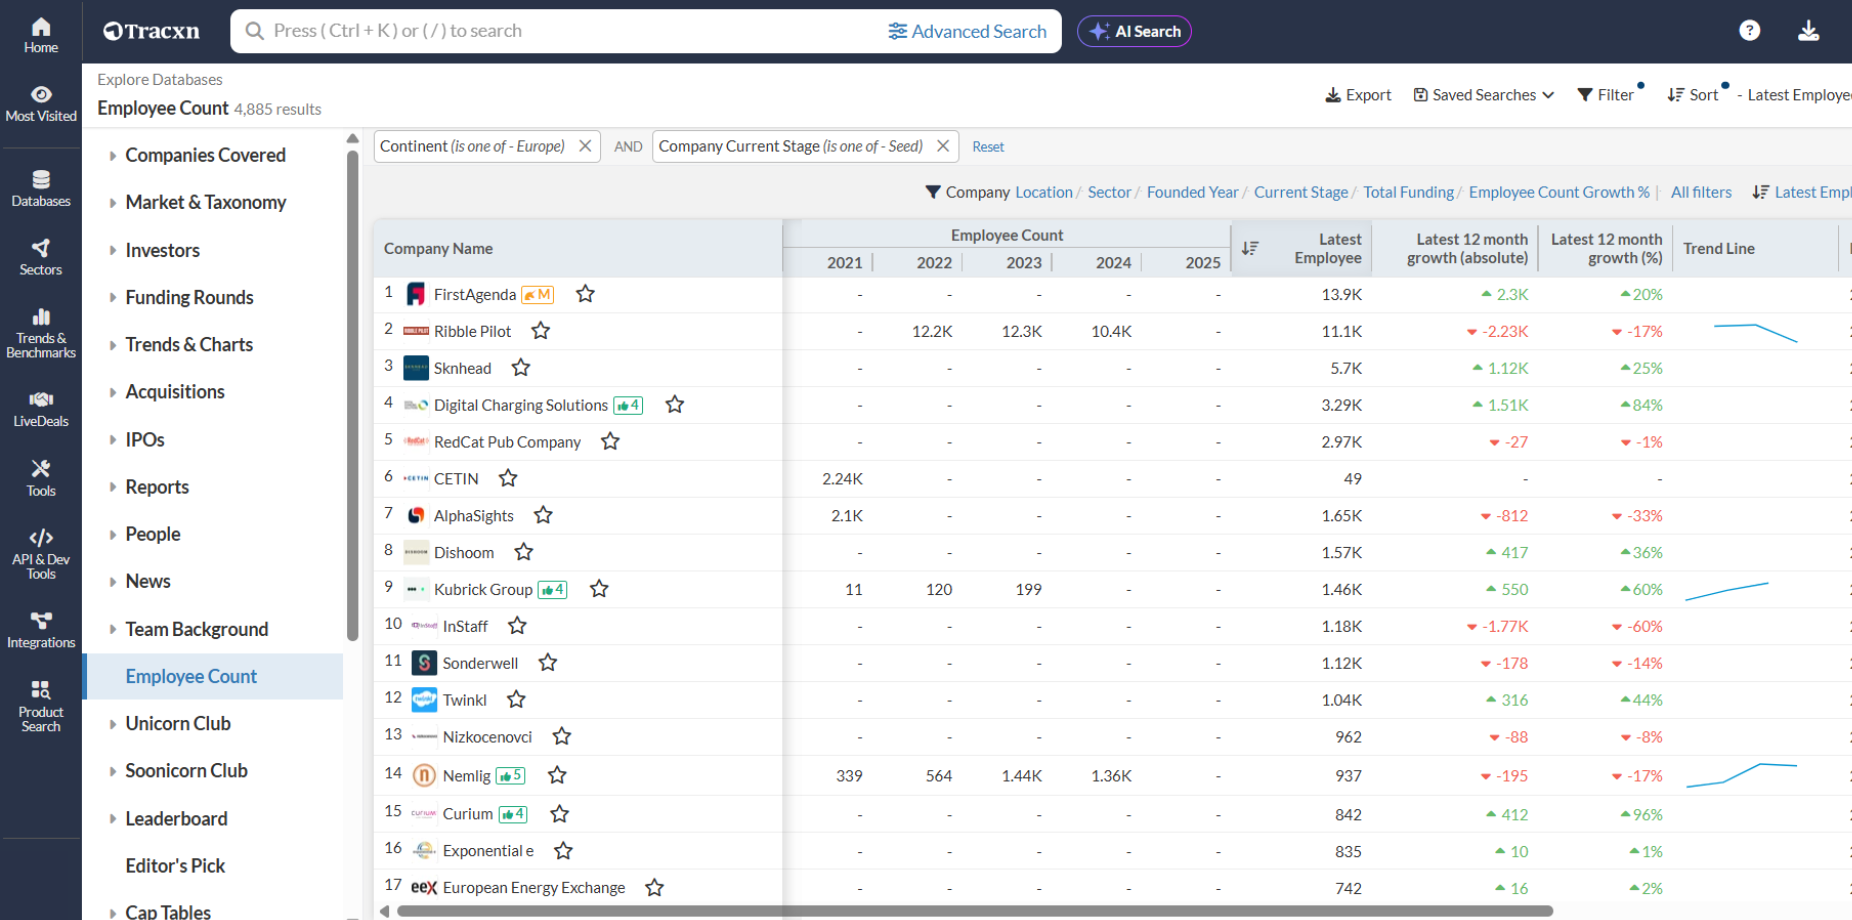
Which seed-stage company in Europe has the largest workforce?
Understand the Talent Landscape
Get a bird’s-eye view of how the global workforce is shifting. See how much a company has expanded, identify hiring leaders by sector and find out which seed stage company has seen the most growth.
Find sector-wise hiring leaders
Track any company's headcount over time
Spot fastest-growing seed-stage companies
Join thousands of teams using Tracxn to track global funding activity

.png)
.png)
.png)

.png)

.png)
.png)
.png)